Bridge Optimizer™ implements the industry’s most advanced algorithms to support optimal risk-based system-level preservation planning of large inventories with tens of thousands of bridges. The algorithms include inductive multi-variate deterioration modeling, quantitative and dynamic risk assessment and asset prioritization, and multi-objective optimization. Bridge Optimizer™ offers a rich feature set unparalleled by any other software in the market today.


Optimized Plans & Detailed Trade-Off Analysis
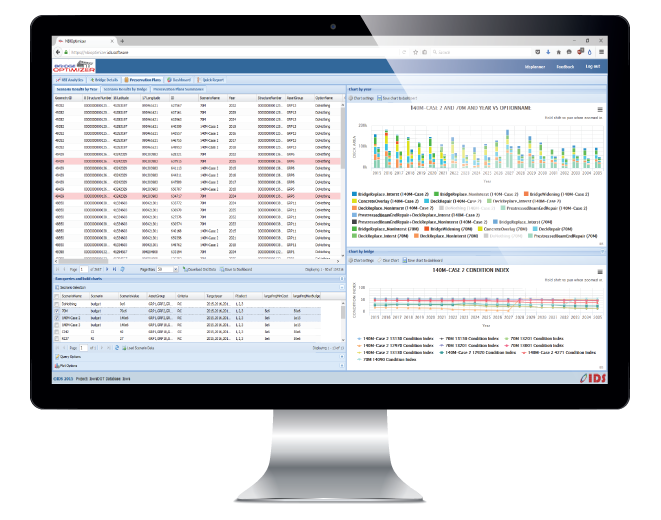
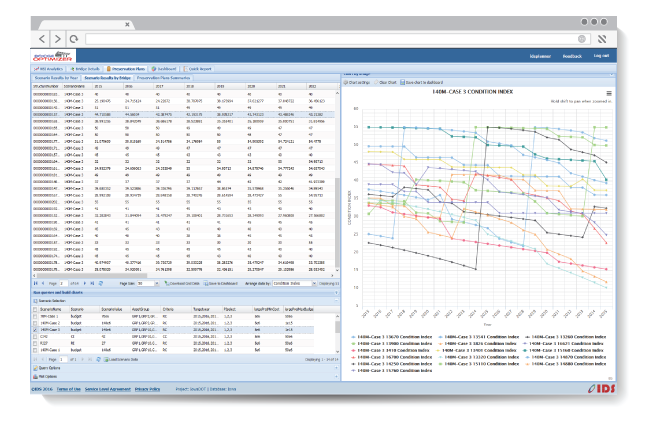
Bridge Optimizer™ allows users to investigate and compare any number of planning scenarios, including: (1) scenarios to evaluate the impact of funding levels on system-level condition and risk measures; and (2) scenarios to evaluate funding requirements to achieve desired condition/risk objectives. For each defined scenario, Bridge Optimizer™ generates optimal and feasible project lists, on annual basis. Selected projects satisfy all defined constraints and are guaranteed to be optimal. Trade-off analysis of various scenarios will provide bridge engineers with rich analytics tools (e.g., queries, charting functions, etc.) to quantitatively assess the consequences of various policies and scenarios on the condition and risk levels of individual bridges, bridge groups, or on the entire inventory. This analysis will help engineers to make rational and evidence-based decisions to determine the most cost-effective long-term system-level preservation plan.

Multi-Variate Inductive Deterioration Modeling
Bridge Optimizer™ implements a novel multi-variate inductive approach based on supervised statistical learning techniques to predict future condition states of bridge elements and accurately represent the stochastic nature of the deterioration process. Unlike other approaches (such as Markov chain, survival analysis, or regression models) which assume that the deterioration process follows a “known” distribution function, our inductive algorithm does not assume any “prior” knowledge of the deterioration function and can efficiently account for the impact of a wide range variables. The algorithm analyzes actual inspection data and correlates a range of independent physical and operational variables (e.g., age, traffic volume, design load, deck type, etc.) with condition and capacity degradation of bridge elements to automatically “infer” (or “discover”) the distribution function that most closely captures the relationship between these variables and the condition state of bridge elements.

Risk-Based Prioritization
Bridge Optimizer™ implements a unique risk-based prioritization algorithm that balances the need to address condition state of bridge elements (or likelihood of failure) and the consequence of failure (or criticality) by ranking bridges based on their potential “risk.” Risk is assessed to reflect bridges structural or functional inadequacy to meet desired performance levels. For each bridge, a “risk index” is calculated as the product of the consequence of failure and the likelihood of failure. Estimated condition ratings are used as proxy for likelihood of failure. Consequence of failure (or criticality) is determined by evaluating a set of rules and weights that involve static or time-dependent risk factors (e.g., functional class, traffic volume, detour length, etc.). Calculated risk indices are then used to prioritize bridges to reflect urgency of preservation actions. Thresholds of the risk indices are used to indicate “relative” priority of bridges.
Customizable Preservation Methods Database
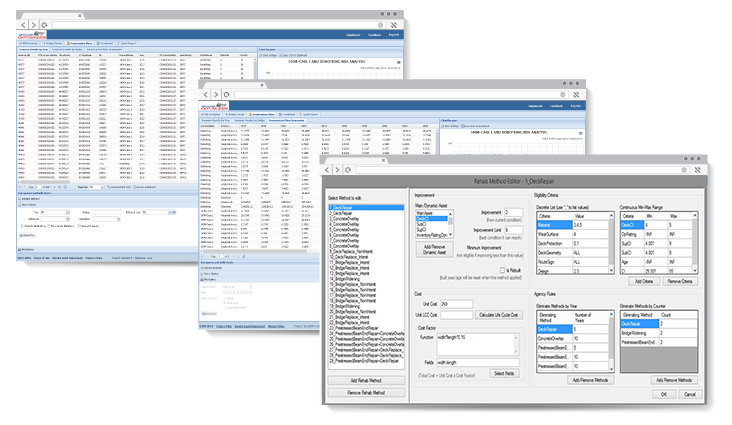
Bridge Optimizer™ maintains a comprehensive built-in database of bridge preservation methods, including bridge replacement, deck replacement, deck overlay, deck repair, bridge widening, prestressed beam end repair, etc. The database includes a set of built-in and customizable constraints and formulae for calculating costs and benefits, as well as to determine applicability constraints of each method. Bridge Optimizer™ provides a flexible interface to customize the database to reflect specific agency’s policies or preferences. Applicability constraints are defined to limit the use of preservation methods to ensure technical and economic feasibility in any given circumstances. Formulae for estimating lifecycle costs can defined based on any number of variables (e.g., unit cost, deck area, condition state, etc.). Formula to calculate expected impact (or benefits) are defined in terms of “condition improvement increments,” which are used as a surrogate for such benefits as service life extension, risk reduction, savings in user cost, etc.

Advanced Data Analytics
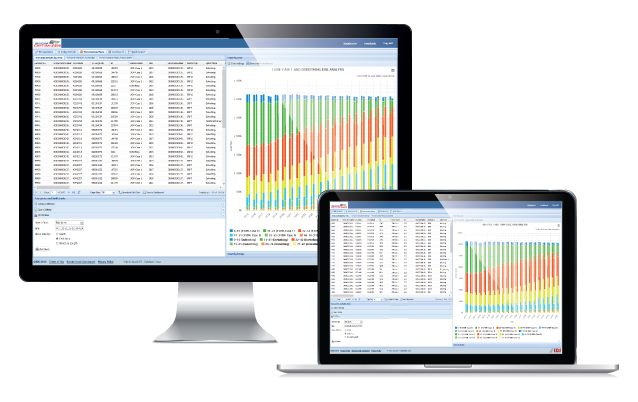
Bridge Optimizer™ maintains a centralized enterprise high-performance relational database that integrates bridge physical and operational data, spatial data, condition and risk data, replacement/rehabilitation methods data, and preservation planning scenarios data. Bridge Optimizer™ offers data management services such as data security, access control, and replication, and supports import/export functions from/to virtually all commonly used formats. The database can be efficiently queried using a user-friendly Query Builder. Bridge groups can be easily created, stored, and analyzed. Users can use a wide range of charting functions (boxplots, scatter plots, histograms, and pie charts) to efficiently investigate data trends and relationships. Queries and charts can be created for individual bridges, group of bridges, or the entire inventory. Historical data trends can be identified using linear, polynomial, or exponential curve fitting functions.
High-Performance Cloud Services
Bridge Optimizer™ Software as a Service (SaaS) front-end application, hosted on the IDS high-performance high-availability and secure cloud, offers users 24/7/365 access from anywhere using a web browser. Users can access a comprehensive set of features including analytics functions, reports, maps, dashboards, preservation plans, and documents. We offer flexible licensing and pricing options subscription plans for Bridge Optimizer’s SaaS application.
Using Bridge Optimizer™ SaaS application, collections of created charts and tables can be stored in the dashboard to be shared with a wider audience. Two dashboards are available: one to store data analysis charts and tables, and the second to store charts and tables of the results of preservation planning scenarios. The software also maintains and links documents related to individual bridges, where users can easily upload, download, delete, and view any bridge document such as inspection reports, CAD drawings, spreadsheets, photos, etc. Bridge Optimizer™ also links bridge locations with Google Map® and Street View®. Users can easily create, save, and share map layers of any group of bridges. If bridge locations are not defined accurately, users can easily edit these locations by simply moving markers on the map. Users can also measure length and surface areas, and retrieve elevations directly from the map.

Customizable
Bridge Optimizer™ can be easily customized to reflect agency-specific data schema, preservation policies, planning constraints and scenarios, and various forms of presentations and reporting. The software can be customized based on agency-specific data and inspection standards such as the National Bridge Inventory (NBI) or Ontario Structure Inspection Manual (OSIM). Bridge Optimizer™ can seamlessly integrate and share data with other software, including ESRI’s ArcGIS, or other work management and mobile inspection systems, or document management systems (e.g., SharePoint).
